The SHOW PLAN SQL statement and the "plan": N JSON interface option display the query execution plan. The plan is generated and stored during the actual execution, so in the case of SQL, profiling must be enabled in the current session before running that statement. This can be done with a SET profiling=1 statement.
Two items are returned in SQL mode:
transformed_tree, which displays the full-text query decomposition.enabled_indexes, which provides information about effective secondary indexes.
To view the query execution plan in a JSON query, add "plan": N to the query. The result will appear as a plan property in the result set. N can be one of the following:
- 1 - Displays only the textual plan of the root node, similar to the one returned in the
SHOW PLANSQL query. This is the most compact form. - 2 - Displays only the JSON object plan, useful for processing.
- 3 - Displays a JSON object with a textual description of every node. Note that the description for child nodes is also present and repeats part of the parent's description, which makes the whole representation quite large.
- SQL
- JSON
POST /search
{
  "table": "hn_small",
  "query": {"query_string": "dog|cat"},
  "_source": { "excludes":["*"] },
  "limit": 0,
  "plan": 3
}*************************** 1. row ***************************
Variable: transformed_tree
Value: OR(
AND(KEYWORD(dog, querypos=1)),
AND(KEYWORD(cat, querypos=2)))
*************************** 2. row ***************************
Variable: enabled_indexes
Value:
2 rows in set (0.00 sec){
"took": 0,
"timed_out": false,
"hits": {
"total": 4453,
"total_relation": "eq",
"hits": []
},
"plan": {
"query": {
"type": "OR",
"description": "OR( AND(KEYWORD(dog, querypos=1)), AND(KEYWORD(cat, querypos=2)))",
"children": [
{
"type": "AND",
"description": "AND(KEYWORD(dog, querypos=1))",
"children": [
{
"type": "KEYWORD",
"word": "dog",
"querypos": 1
}
]
},
{
"type": "AND",
"description": "AND(KEYWORD(cat, querypos=2))",
"children": [
{
"type": "KEYWORD",
"word": "cat",
"querypos": 2
}
]
}
]
}
}
}set profiling=1;
select * from hn_small where match('dog|cat') limit 0;
show plan;In some cases, the evaluated query tree can be quite different from the original one due to expansions and other transformations.
- SQL
- JSON
POST /search
{
  "table": "forum",
  "query": {"query_string": "@title way* @content hey"},
  "_source": { "excludes":["*"] },
  "limit": 1,
  "plan": 1
}Query OK, 0 rows affected (0.00 sec)
+--------+
| id |
+--------+
| 711651 |
+--------+
1 row in set (0.04 sec)
+------------------+-------------------------------------------------------------------------------------------------------------------------------------------------------------------------------------------------------------------------------------------------------------------------------------------------------------------------------------------------------------------------------------------------------------------------+
| Variable | Value |
+------------------+-------------------------------------------------------------------------------------------------------------------------------------------------------------------------------------------------------------------------------------------------------------------------------------------------------------------------------------------------------------------------------------------------------------------------+
| transformed_tree | AND(
OR(
OR(
AND(fields=(title), KEYWORD(wayne, querypos=1, expanded)),
OR(
AND(fields=(title), KEYWORD(ways, querypos=1, expanded)),
AND(fields=(title), KEYWORD(wayyy, querypos=1, expanded)))),
AND(fields=(title), KEYWORD(way, querypos=1, expanded)),
OR(fields=(title), KEYWORD(way*, querypos=1, expanded))),
AND(fields=(content), KEYWORD(hey, querypos=2))) |
+------------------+-------------------------------------------------------------------------------------------------------------------------------------------------------------------------------------------------------------------------------------------------------------------------------------------------------------------------------------------------------------------------------------------------------------------------+
1 row in set (0.00 sec){
"took":33,
"timed_out":false,
"hits":
{
"total":105,
"hits":
[
{
"_id": 711651,
"_score":2539,
"_source":{}
}
]
},
"plan":
{
"query":
{
"description":"AND( OR( OR( AND(fields=(title), KEYWORD(wayne, querypos=1, expanded)), OR( AND(fields=(title), KEYWORD(ways, querypos=1, expanded)), AND(fields=(title), KEYWORD(wayyy, querypos=1, expanded)))), AND(fields=(title), KEYWORD(way, querypos=1, expanded)), OR(fields=(title), KEYWORD(way*, querypos=1, expanded))), AND(fields=(content), KEYWORD(hey, querypos=2)))"
}
}
}SET profiling=1;
SELECT id FROM forum WHERE MATCH('@title way* @content hey') LIMIT 1;
SHOW PLAN;See also EXPLAIN QUERY. It displays the execution tree of a full-text query without actually executing the query. Note that when using SHOW PLAN after a query to a real-time table, the result will be based on a random disk/RAM chunk. Therefore, if you have recently modified the table's tokenization settings, or if the chunks vary significantly in terms of dictionaries, etc., you might not get the result you are expecting. Take this into account and consider using EXPLAIN QUERY as well.
query property contains the transformed full-text query tree. Each node contains:
type: node type. Can beAND,OR,PHRASE,KEYWORD, etc.description: query subtree for this node shown as a string (inSHOW PLANformat).children: child nodes, if any.max_field_pos: maximum position within a field.word: transformed keyword. Keyword nodes only.querypos: position of this keyword in a query. Keyword nodes only.excluded: keyword excluded from query. Keyword nodes only.expanded: keyword added by prefix expansion. Keyword nodes only.field_start: keyword must occur at the very start of the field. Keyword nodes only.field_end: keyword must occur at the very end of the field. Keyword nodes only.boost: keyword IDF will be multiplied by this. Keyword nodes only.
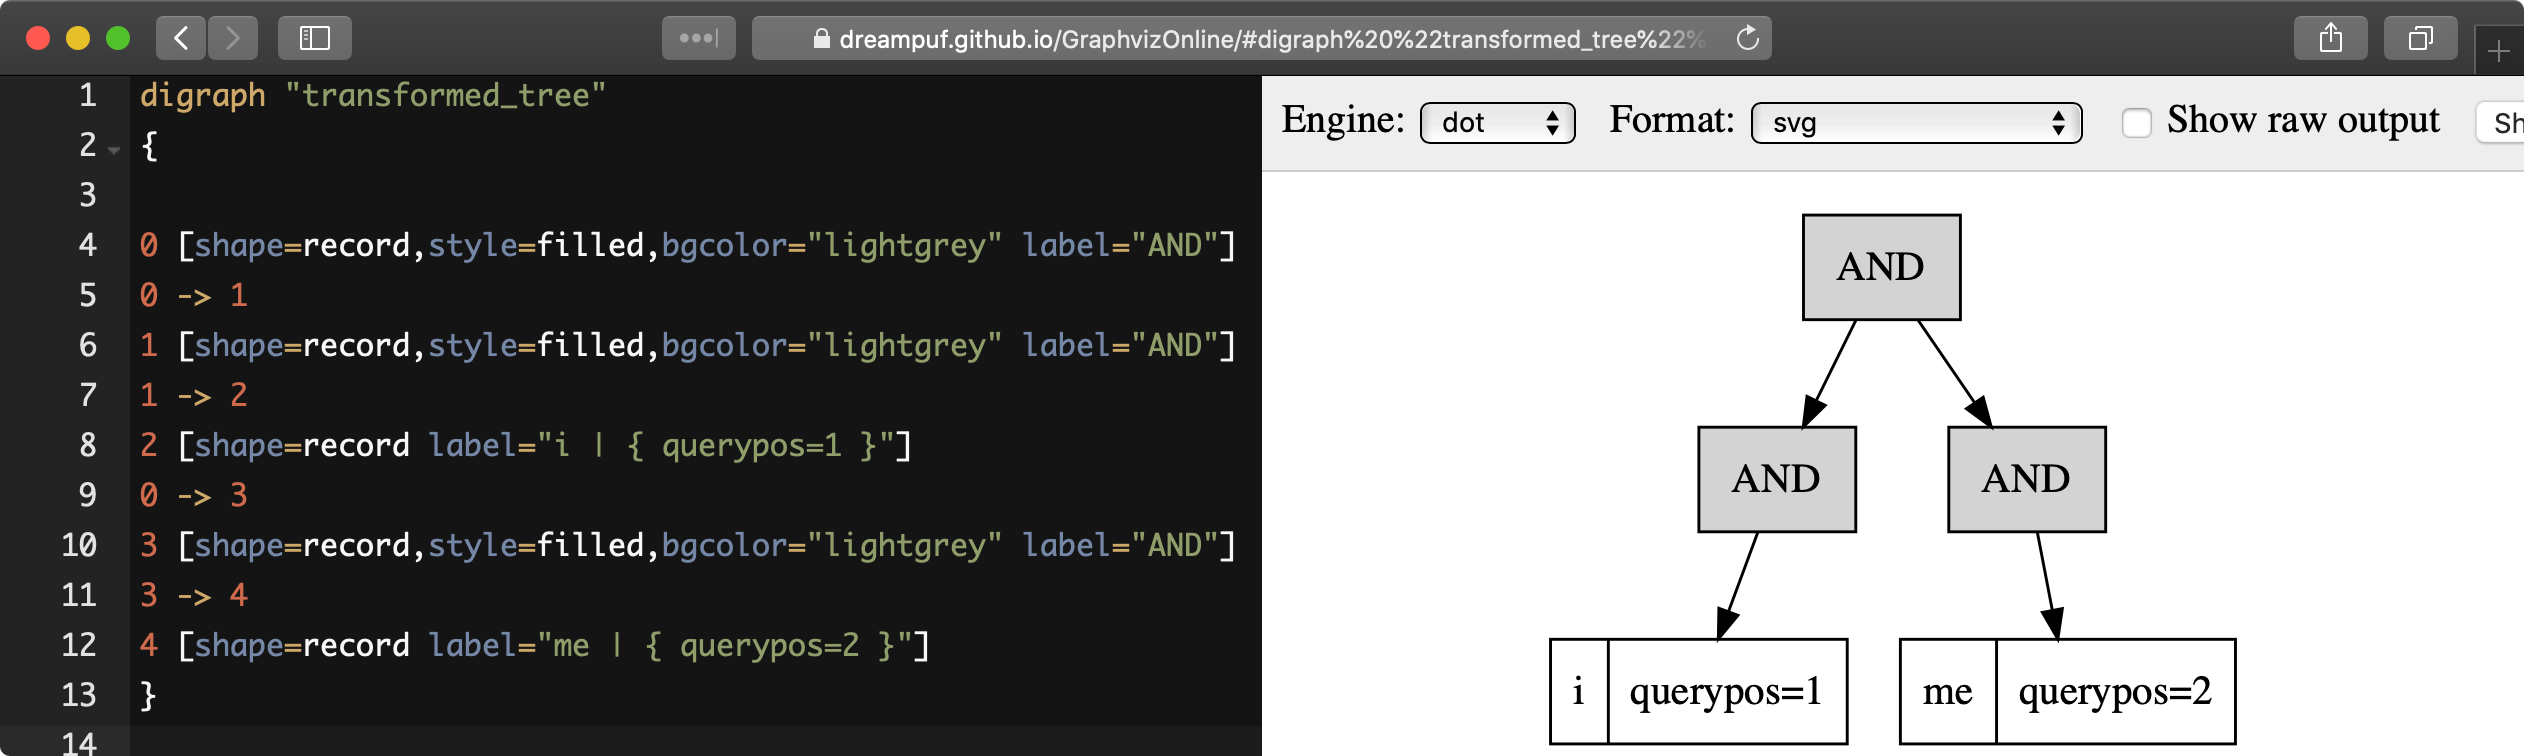
SHOW PLAN format=dot allows returning the full-text query execution tree in a hierarchical format suitable for visualization by existing tools, such as https://dreampuf.github.io/GraphvizOnline:
MySQL [(none)]> show plan option format=dot\G
*************************** 1. row ***************************
Variable: transformed_tree
   Value: digraph "transformed_tree"
{
0 [shape=record,style=filled,bgcolor="lightgrey" label="AND"]
0 -> 1
1 [shape=record,style=filled,bgcolor="lightgrey" label="AND"]
1 -> 2
2 [shape=record label="i | { querypos=1 }"]
0 -> 3
3 [shape=record,style=filled,bgcolor="lightgrey" label="AND"]
3 -> 4
4 [shape=record label="me | { querypos=2 }"]
}
≫ Table settings and status
The SHOW TABLE INDEXES SQL statement displays the secondary indexes available for a specified table, along with their properties. Secondary indexes improve query performance by creating additional data structures that speed up searches on specific columns.
The syntax is:
SHOW TABLE table_name INDEXESThe displayed properties include the following columns:
- Name: The name of the secondary index. Can be used in query optimizer hints.
- Type: The type of data stored in the secondary index. For plain attributes, it matches the type of the original attribute. For secondary indexes generated from JSON attributes, the type is deduced by scanning all documents and determining the types of all JSON properties.
- Enabled: Indicates whether the index is currently enabled and can be used to improve search speed. When an attribute is updated, the secondary index for that attribute is temporarily disabled until the index is rebuilt. You can rebuild disabled indexes using the ALTER TABLE ... REBUILD SECONDARY command.
- Percent: In an RT table, different disk chunks may contain different secondary indexes especially when JSON attributes are used. This percentage shows how many chunks have an index with the same name, type, and enabled state.
Note: For RT tables, secondary indexes are only created for disk chunks, not for data in RAM segments. When you first insert data into an RT table, it stays in RAM and no secondary indexes will be shown. The indexes become visible only after the data is flushed to disk chunks, which by default happens automatically when the table becomes active (receives both inserts and searches).
- SQL
- JSON
SHOW TABLE test INDEXES;POST /sql?mode=raw -d "SHOW TABLE test INDEXES"+------------------------------+--------+---------+---------+
| Name | Type | Enabled | Percent |
+------------------------------+--------+---------+---------+
| j['addresses'] | uint32 | 1 | 100 |
| j['addresses']['a1'] | uint32 | 1 | 100 |
| j['addresses']['a2'] | uint32 | 1 | 100 |
| j['addresses']['a3'] | uint32 | 1 | 100 |
| j['addresses']['a4'] | uint32 | 1 | 100 |
| j['addresses']['a5'] | uint32 | 1 | 100 |
| j['addresses']['a6'] | uint32 | 1 | 100 |
| j['factor'] | uint32 | 1 | 100 |
| j['int_arr'] | uint32 | 1 | 100 |
| j['tags'] | uint32 | 1 | 100 |
| id | int64 | 1 | 100 |
| j['price'] | float | 1 | 100 |
| j['addresses']['a1']['id'] | string | 1 | 100 |
| j['addresses']['a1']['name'] | string | 1 | 100 |
| j['addresses']['a2']['id'] | string | 1 | 100 |
| j['addresses']['a2']['name'] | string | 1 | 100 |
| j['addresses']['a3']['id'] | string | 1 | 100 |
| j['addresses']['a3']['name'] | string | 1 | 100 |
| j['addresses']['a4']['id'] | string | 1 | 100 |
| j['addresses']['a4']['name'] | string | 1 | 100 |
| j['addresses']['a5']['id'] | string | 1 | 100 |
| j['addresses']['a5']['name'] | string | 1 | 100 |
| j['addresses']['a6']['id'] | string | 1 | 100 |
| j['addresses']['a6']['name'] | string | 1 | 100 |
| j['arr'] | string | 1 | 100 |
| j['str'] | string | 1 | 100 |
| j['tags']['1'] | string | 1 | 100 |
| j['tags']['2'] | string | 1 | 100 |
| j['tags']['3'] | string | 1 | 100 |
+------------------------------+--------+---------+---------+
29 rows in set (0.00 sec)[
{
"columns": [
{
"Name": {
"type": "string"
}
},
{
"Type": {
"type": "string"
}
},
{
"Enabled": {
"type": "string"
}
},
{
"Percent": {
"type": "string"
}
}
],
"data": [
{
"Name": "j['addresses']",
"Type": "uint32",
"Enabled": "1",
"Percent": 100
},
{
"Name": "j['addresses']['a1']",
"Type": "uint32",
"Enabled": "1",
"Percent": 100
},
{
"Name": "j['addresses']['a2']",
"Type": "uint32",
"Enabled": "1",
"Percent": 100
},
{
"Name": "j['addresses']['a3']",
"Type": "uint32",
"Enabled": "1",
"Percent": 100
},
{
"Name": "j['addresses']['a4']",
"Type": "uint32",
"Enabled": "1",
"Percent": 100
},
{
"Name": "j['addresses']['a5']",
"Type": "uint32",
"Enabled": "1",
"Percent": 100
},
{
"Name": "j['addresses']['a6']",
"Type": "uint32",
"Enabled": "1",
"Percent": 100
},
{
"Name": "j['factor']",
"Type": "uint32",
"Enabled": "1",
"Percent": 100
},
{
"Name": "j['int_arr']",
"Type": "uint32",
"Enabled": "1",
"Percent": 100
},
{
"Name": "j['tags']",
"Type": "uint32",
"Enabled": "1",
"Percent": 100
},
{
"Name": "id",
"Type": "int64",
"Enabled": "1",
"Percent": 100
},
{
"Name": "j['price']",
"Type": "float",
"Enabled": "1",
"Percent": 100
},
{
"Name": "j['addresses']['a1']['id']",
"Type": "string",
"Enabled": "1",
"Percent": 100
},
{
"Name": "j['addresses']['a1']['name']",
"Type": "string",
"Enabled": "1",
"Percent": 100
},
{
"Name": "j['addresses']['a2']['id']",
"Type": "string",
"Enabled": "1",
"Percent": 100
},
{
"Name": "j['addresses']['a2']['name']",
"Type": "string",
"Enabled": "1",
"Percent": 100
},
{
"Name": "j['addresses']['a3']['id']",
"Type": "string",
"Enabled": "1",
"Percent": 100
},
{
"Name": "j['addresses']['a3']['name']",
"Type": "string",
"Enabled": "1",
"Percent": 100
},
{
"Name": "j['addresses']['a4']['id']",
"Type": "string",
"Enabled": "1",
"Percent": 100
},
{
"Name": "j['addresses']['a4']['name']",
"Type": "string",
"Enabled": "1",
"Percent": 100
},
{
"Name": "j['addresses']['a5']['id']",
"Type": "string",
"Enabled": "1",
"Percent": 100
},
{
"Name": "j['addresses']['a5']['name']",
"Type": "string",
"Enabled": "1",
"Percent": 100
},
{
"Name": "j['addresses']['a6']['id']",
"Type": "string",
"Enabled": "1",
"Percent": 100
},
{
"Name": "j['addresses']['a6']['name']",
"Type": "string",
"Enabled": "1",
"Percent": 100
},
{
"Name": "j['arr']",
"Type": "string",
"Enabled": "1",
"Percent": 100
},
{
"Name": "j['str']",
"Type": "string",
"Enabled": "1",
"Percent": 100
},
{
"Name": "j['tags']['1']",
"Type": "string",
"Enabled": "1",
"Percent": 100
},
{
"Name": "j['tags']['2']",
"Type": "string",
"Enabled": "1",
"Percent": 100
},
{
"Name": "j['tags']['3']",
"Type": "string",
"Enabled": "1",
"Percent": 100
}
],
"total": 29,
"error": "",
"warning": ""
}
],
SHOW TABLE STATUS is an SQL statement that displays various per-table statistics.
The syntax is:
SHOW TABLE table_name STATUSDepending on index type, displayed statistic includes different set of rows:
- template:
index_type. - distributed:
index_type,query_time_1min,query_time_5min,query_time_15min,query_time_total,exact_query_time_1min,exact_query_time_5min,exact_query_time_15min,exact_query_time_total,found_rows_1min,found_rows_5min,found_rows_15min,found_rows_total. - percolate:
index_type,stored_queries,ram_bytes,disk_bytes,max_stack_need,average_stack_base,desired_thread_stack,tid,tid_saved,query_time_1min,query_time_5min,query_time_15min,query_time_total,exact_query_time_1min,exact_query_time_5min,exact_query_time_15min,exact_query_time_total,found_rows_1min,found_rows_5min,found_rows_15min,found_rows_total. - plain:
index_type,indexed_documents,indexed_bytes, may be set offield_tokens_*andtotal_tokens,ram_bytes,disk_bytes,disk_mapped,disk_mapped_cached,disk_mapped_doclists,disk_mapped_cached_doclists,disk_mapped_hitlists,disk_mapped_cached_hitlists,killed_documents,killed_rate,query_time_1min,query_time_5min,query_time_15min,query_time_total,exact_query_time_1min,exact_query_time_5min,exact_query_time_15min,exact_query_time_total,found_rows_1min,found_rows_5min,found_rows_15min,found_rows_total. - rt:
index_type,indexed_documents,indexed_bytes, may be set offield_tokens_*andtotal_tokens,ram_bytes,disk_bytes,disk_mapped,disk_mapped_cached,disk_mapped_doclists,disk_mapped_cached_doclists,disk_mapped_hitlists,disk_mapped_cached_hitlists,killed_documents,killed_rate,ram_chunk,ram_chunk_segments_count,disk_chunks,mem_limit,mem_limit_rate,ram_bytes_retired,optimizing,locked,tid,tid_saved,query_time_1min,query_time_5min,query_time_15min,query_time_total,exact_query_time_1min,exact_query_time_5min,exact_query_time_15min,exact_query_time_total,found_rows_1min,found_rows_5min,found_rows_15min,found_rows_total.
Here is the meaning of these values:
index_type: currently one ofdisk,rt,percolate,template, anddistributed.indexed_documents: number of indexed documents.indexed_bytes: overall size of indexed text. Notice, this value is not strict, since in full-text index that is impossible to strictly recover back stored text to measure it.stored_queries: number of percolate queries, stored in the table.field_tokens_XXX: optional, total per-field lengths (in tokens) across the entire table (used internally forBM25AandBM25Franking functions). Only available for tables built withindex_field_lengths=1.total_tokens: optional, overall sum of allfield_tokens_XXX.ram_bytes: total RAM occupied by table.disk_bytes: total disk space, occupied by table.disk_mapped: total size of file mappings.disk_mapped_cached: total size of file mappings actually cached in RAM.disk_mapped_doclistsanddisk_mapped_cached_doclists: portion of total and cached mappings belonging to document lists.disk_mapped_hitlistsanddisk_mapped_cached_hitlists: portion of total and cached mappings belonging to hit lists. Doclists and hitlists values are shown separately since they're typically large (e.g., about 90% of the whole table's size).killed_documentsandkilled_rate: the first indicates the number of deleted documents and the rate of deleted/indexed. Technically, deleting a document means suppressing it in search output, but it still physically exists in the table and will only be purged after merging/optimizing the table.ram_chunk: size of the RAM chunk of real-time or percolate table.ram_chunk_segments_count: RAM chunk is internally composed of segments, typically no more than 32. This line shows the current count.disk_chunks: number of disk chunks in the real-time table.mem_limit: actual value ofrt_mem_limitfor the table.mem_limit_rate: the rate at which the RAM chunk will be flushed as a disk chunk, e.g., ifrt_mem_limitis 128M and the rate is 50%, a new disk chunk will be saved when the RAM chunk exceeds 64M.ram_bytes_retired: represents the size of garbage in RAM chunks (e.g., deleted or replaced documents not yet permanently removed).optimizing: a value greater than 0 indicates that the table is currently performing optimization (i.e. it is merging some disk chunks right now).locked: a value greater than 0 indicates that the table is currently locked by FREEZE. The number represents how many times the table has been frozen. For instance, a table might be frozen bymanticore-backupand then frozen again by replication. It should only be completely unfrozen when no other process requires it to be frozen.max_stack_need: stack space we need to calculate most complex from the stored percolate queries. That is dynamic value, depends on build details as compiler, optimization, hardware, etc.average_stack_base: stack space which is usually occupied on start of calculation of percolate query.desired_thread_stack: sum of above values, rounded up to 128 bytes edge. If this value is greater thanthread_stack, you may not executecall pqover this table, as some stored queries will fail. Defaultthread_stackvalue is 1M (which is 1048576); other values should be configured.tidandtid_saved: represent the state of saving the table.tidincreases with each change (transaction).tid_savedshows the maxtidof the state saved in a RAM chunk in<table>.ramfile. When the numbers differ, some changes exist only in RAM and are also backed by binlog (if enabled). PerformingFLUSH TABLEor scheduling periodic flushing saves these changes. After flushing, the binlog is cleared, andtid_savedrepresents the new actual state.query_time_*,exact_query_time_*: query execution time statistics for the last 1 minute, 5 minutes, 15 minutes, and total since server start; data is encapsulated as a JSON object, including the number of queries and min, max, avg, 95, and 99 percentile values.found_rows_*: statistics of rows found by queries; provided for the last 1 minute, 5 minutes, 15 minutes, and total since server start; data is encapsulated as a JSON object, including the number of queries and min, max, avg, 95, and 99 percentile values.command_*: counters for the total number of times a specific command has been successfully executed against this table.search_stats_ms_*: statistics on the execution time (in milliseconds) for search queries. The * indicates the time window (e.g., 1min, 5min, 15min, total). These stats are calculated over sliding windows of 1, 5, and 15 minutes, showing average, minimum, maximum, and 95th/99th percentile values for query times. For distributed tables, these values reflect aggregated local and remote table contributions and can be higher than a single node-level query wall/real value.insert_replace_stats_ms_*: statistics on the execution time (in milliseconds) for insert and replace queries. The * indicates the time window (e.g., 1min, 5min, 15min, total). These stats are calculated over sliding windows of 1, 5, and 15 minutes, showing average, minimum, maximum, and 95th/99th percentile values for query times.update_stats_ms_*: statistics on the execution time (in milliseconds) for update queries. The * indicates the time window (e.g., 1min, 5min, 15min, total). These stats are calculated over sliding windows of 1, 5, and 15 minutes, showing average, minimum, maximum, and 95th/99th percentile values for query times.
- SQL
- JSON
- PHP
- Python
- Python-asyncio
- Javascript
- Java
- C#
- Rust
- TypeScript
- Go
mysql> SHOW TABLE statistic STATUS;POST /sql?mode=raw -d "SHOW TABLE t STATUS"$index->status();utilsApi.sql('SHOW TABLE statistic STATUS')await utilsApi.sql('SHOW TABLE statistic STATUS')res = await utilsApi.sql('SHOW TABLE statistic STATUS');utilsApi.sql("SHOW TABLE statistic STATUS");utilsApi.Sql("SHOW TABLE statistic STATUS");utils_api.sql("SHOW TABLE statistic STATUS", Some(true)).await;res = await utilsApi.sql('SHOW TABLE statistic STATUS');apiClient.UtilsAPI.Sql(context.Background()).Body("SHOW TABLE statistic STATUS").Execute()+-------------------------------+--------------------------------------------------------------------------+
| Variable_name | Value |
+-------------------------------+--------------------------------------------------------------------------+
| index_type | rt |
| indexed_documents | 146000 |
| indexed_bytes | 149504000 |
| ram_bytes | 87674788 |
| disk_bytes | 1762811 |
| disk_mapped | 794147 |
| disk_mapped_cached | 802816 |
| disk_mapped_doclists | 0 |
| disk_mapped_cached_doclists | 0 |
| disk_mapped_hitlists | 0 |
| disk_mapped_cached_hitlists | 0 |
| killed_documents | 0 |
| killed_rate | 0.00% |
| ram_chunk | 86865484 |
| ram_chunk_segments_count | 24 |
| disk_chunks | 1 |
| mem_limit | 134217728 |
| mem_limit_rate | 95.00% |
| ram_bytes_retired | 0 |
| optimizing | 1 |
| locked | 0 |
| tid | 0 |
| tid_saved | 0 |
| query_time_1min | {"queries":0, "avg":"-", "min":"-", "max":"-", "pct95":"-", "pct99":"-"} |
| query_time_5min | {"queries":0, "avg":"-", "min":"-", "max":"-", "pct95":"-", "pct99":"-"} |
| query_time_15min | {"queries":0, "avg":"-", "min":"-", "max":"-", "pct95":"-", "pct99":"-"} |
| query_time_total | {"queries":0, "avg":"-", "min":"-", "max":"-", "pct95":"-", "pct99":"-"} |
| found_rows_1min | {"queries":0, "avg":"-", "min":"-", "max":"-", "pct95":"-", "pct99":"-"} |
| found_rows_5min | {"queries":0, "avg":"-", "min":"-", "max":"-", "pct95":"-", "pct99":"-"} |
| found_rows_15min | {"queries":0, "avg":"-", "min":"-", "max":"-", "pct95":"-", "pct99":"-"} |
| found_rows_total | {"queries":0, "avg":"-", "min":"-", "max":"-", "pct95":"-", "pct99":"-"} |
| command_search | 2 |
| command_excerpt | 0 |
| command_update | 3 |
| command_keywords | 0 |
| command_status | 2 |
| command_delete | 0 |
| command_insert | 1 |
| command_replace | 0 |
| command_commit | 0 |
| command_suggest | 0 |
| command_callpq | 0 |
| command_getfield | 0 |
| insert_replace_stats_ms_avg | 0.284 0.284 0.284 |
| insert_replace_stats_ms_min | 0.284 0.284 0.284 |
| insert_replace_stats_ms_max | 0.284 0.284 0.284 |
| insert_replace_stats_ms_pct95 | 0.284 0.284 0.284 |
| insert_replace_stats_ms_pct99 | 0.284 0.284 0.284 |
| search_stats_ms_avg | 0.000 0.000 0.000 |
| search_stats_ms_min | 0.000 0.000 0.000 |
| search_stats_ms_max | 0.000 0.000 0.000 |
| search_stats_ms_pct95 | 0.000 0.000 0.000 |
| search_stats_ms_pct99 | 0.000 0.000 0.000 |
| update_stats_ms_avg | 0.479 0.479 0.479 |
| update_stats_ms_min | 0.431 0.431 0.431 |
| update_stats_ms_max | 0.530 0.530 0.530 |
| update_stats_ms_pct95 | 0.530 0.530 0.530 |
| update_stats_ms_pct99 | 0.530 0.530 0.530 |
+-------------------------------+--------------------------------------------------------------------------+
29 rows in set (0.00 sec)[
{
"columns": [
{
"Variable_name": {
"type": "string"
}
},
{
"Value": {
"type": "string"
}
}
],
"data": [
{
"Variable_name": "table_type",
"Value": "rt"
},
{
"Variable_name": "indexed_documents",
"Value": "5"
},
{
"Variable_name": "indexed_bytes",
"Value": "28"
},
{
"Variable_name": "ram_bytes",
"Value": "23400"
},
{
"Variable_name": "disk_bytes",
"Value": "1969"
},
{
"Variable_name": "disk_mapped",
"Value": "196"
},
{
"Variable_name": "disk_mapped_cached",
"Value": "16384"
},
{
"Variable_name": "disk_mapped_doclists",
"Value": "0"
},
{
"Variable_name": "disk_mapped_cached_doclists",
"Value": "0"
},
{
"Variable_name": "disk_mapped_hitlists",
"Value": "0"
},
{
"Variable_name": "disk_mapped_cached_hitlists",
"Value": "0"
},
{
"Variable_name": "killed_documents",
"Value": "0"
},
{
"Variable_name": "killed_rate",
"Value": "0.00%"
},
{
"Variable_name": "ram_chunk",
"Value": "0"
},
{
"Variable_name": "ram_chunk_segments_count",
"Value": "0"
},
{
"Variable_name": "disk_chunks",
"Value": "1"
},
{
"Variable_name": "mem_limit",
"Value": "134217728"
},
{
"Variable_name": "mem_limit_rate",
"Value": "95.00%"
},
{
"Variable_name": "ram_bytes_retired",
"Value": "0"
},
{
"Variable_name": "optimizing",
"Value": "0"
},
{
"Variable_name": "locked",
"Value": "0"
},
{
"Variable_name": "tid",
"Value": "7"
},
{
"Variable_name": "tid_saved",
"Value": "7"
},
{
"Variable_name": "query_time_1min",
"Value": "{\"queries\":0, \"avg\":\"-\", \"min\":\"-\", \"max\":\"-\", \"pct95\":\"-\", \"pct99\":\"-\"}"
},
{
"Variable_name": "query_time_5min",
"Value": "{\"queries\":0, \"avg\":\"-\", \"min\":\"-\", \"max\":\"-\", \"pct95\":\"-\", \"pct99\":\"-\"}"
},
{
"Variable_name": "query_time_15min",
"Value": "{\"queries\":0, \"avg\":\"-\", \"min\":\"-\", \"max\":\"-\", \"pct95\":\"-\", \"pct99\":\"-\"}"
},
{
"Variable_name": "query_time_total",
"Value": "{\"queries\":30, \"avg_sec\":0.324, \"min_sec\":0.051, \"max_sec\":1.718, \"pct95_sec\":1.017, \"pct99_sec\":1.718}"
},
{
"Variable_name": "found_rows_1min",
"Value": "{\"queries\":0, \"avg\":\"-\", \"min\":\"-\", \"max\":\"-\", \"pct95\":\"-\", \"pct99\":\"-\"}"
},
{
"Variable_name": "found_rows_5min",
"Value": "{\"queries\":0, \"avg\":\"-\", \"min\":\"-\", \"max\":\"-\", \"pct95\":\"-\", \"pct99\":\"-\"}"
},
{
"Variable_name": "found_rows_15min",
"Value": "{\"queries\":0, \"avg\":\"-\", \"min\":\"-\", \"max\":\"-\", \"pct95\":\"-\", \"pct99\":\"-\"}"
},
{
"Variable_name": "found_rows_total",
"Value": "{\"queries\":30, \"avg\":2, \"min\":0, \"max\":5, \"pct95\":5, \"pct99\":5}"
},
{
"Variable_name": "command_search",
"Value": "30"
},
{
"Variable_name": "command_excerpt",
"Value": "3"
},
{
"Variable_name": "command_update",
"Value": "0"
},
{
"Variable_name": "command_keywords",
"Value": "0"
},
{
"Variable_name": "command_status",
"Value": "1"
},
{
"Variable_name": "command_delete",
"Value": "1"
},
{
"Variable_name": "command_insert",
"Value": "6"
},
{
"Variable_name": "command_replace",
"Value": "0"
},
{
"Variable_name": "command_commit",
"Value": "0"
},
{
"Variable_name": "command_suggest",
"Value": "0"
},
{
"Variable_name": "command_callpq",
"Value": "0"
},
{
"Variable_name": "command_getfield",
"Value": "0"
},
{
"Variable_name": "insert_replace_stats_ms_avg",
"Value": "N/A N/A N/A"
},
{
"Variable_name": "insert_replace_stats_ms_min",
"Value": "N/A N/A N/A"
},
{
"Variable_name": "insert_replace_stats_ms_max",
"Value": "N/A N/A N/A"
},
{
"Variable_name": "insert_replace_stats_ms_pct95",
"Value": "N/A N/A N/A"
},
{
"Variable_name": "insert_replace_stats_ms_pct99",
"Value": "N/A N/A N/A"
},
{
"Variable_name": "search_stats_ms_avg",
"Value": "N/A N/A N/A"
},
{
"Variable_name": "search_stats_ms_min",
"Value": "N/A N/A N/A"
},
{
"Variable_name": "search_stats_ms_max",
"Value": "N/A N/A N/A"
},
{
"Variable_name": "search_stats_ms_pct95",
"Value": "N/A N/A N/A"
},
{
"Variable_name": "search_stats_ms_pct99",
"Value": "N/A N/A N/A"
},
{
"Variable_name": "update_stats_ms_avg",
"Value": "N/A N/A N/A"
},
{
"Variable_name": "update_stats_ms_min",
"Value": "N/A N/A N/A"
},
{
"Variable_name": "update_stats_ms_max",
"Value": "N/A N/A N/A"
},
{
"Variable_name": "update_stats_ms_pct95",
"Value": "N/A N/A N/A"
},
{
"Variable_name": "update_stats_ms_pct99",
"Value": "N/A N/A N/A"
}
],
"total": 58,
"error": "",
"warning": ""
}
]Array(
[index_type] => rt
[indexed_documents] => 3
[indexed_bytes] => 0
[ram_bytes] => 6678
[disk_bytes] => 611
[ram_chunk] => 990
[ram_chunk_segments_count] => 2
[mem_limit] => 134217728
[ram_bytes_retired] => 0
[optimizing] => 0
[locked] => 0
[tid] => 15
[query_time_1min] => {"queries":1, "avg_sec":0.001, "min_sec":0.001, "max_sec":0.001, "pct95_sec":0.001, "pct99_sec":0.001}
[query_time_5min] => {"queries":1, "avg_sec":0.001, "min_sec":0.001, "max_sec":0.001, "pct95_sec":0.001, "pct99_sec":0.001}
[query_time_15min] => {"queries":1, "avg_sec":0.001, "min_sec":0.001, "max_sec":0.001, "pct95_sec":0.001, "pct99_sec":0.001}
[query_time_total] => {"queries":1, "avg_sec":0.001, "min_sec":0.001, "max_sec":0.001, "pct95_sec":0.001, "pct99_sec":0.001}
[found_rows_1min] => {"queries":1, "avg":3, "min":3, "max":3, "pct95":3, "pct99":3}
[found_rows_5min] => {"queries":1, "avg":3, "min":3, "max":3, "pct95":3, "pct99":3}
[found_rows_15min] => {"queries":1, "avg":3, "min":3, "max":3, "pct95":3, "pct99":3}
[found_rows_total] => {"queries":1, "avg":3, "min":3, "max":3, "pct95":3, "pct99":3}
[command_search] => 2
[command_excerpt] => 0
[command_update] => 3
[command_keywords] => 0
[command_status] => 2
[command_delete] => 0
[command_insert] => 1
[command_replace] => 0
[command_commit] => 0
[command_suggest] => 0
[command_callpq] => 0
[command_getfield] => 0
[insert_replace_stats_ms_avg] => 0.284 0.284 0.284
[insert_replace_stats_ms_min] => 0.284 0.284 0.284
[insert_replace_stats_ms_max] => 0.284 0.284 0.284
[insert_replace_stats_ms_pct95] => 0.284 0.284 0.284
[insert_replace_stats_ms_pct99] => 0.284 0.284 0.284
[search_stats_ms_avg] => 0.000 0.000 0.000
[search_stats_ms_min] => 0.000 0.000 0.000
[search_stats_ms_max] => 0.000 0.000 0.000
[search_stats_ms_pct95] => 0.000 0.000 0.000
[search_stats_ms_pct99] => 0.000 0.000 0.000
[update_stats_ms_avg] => 0.479 0.479 0.479
[update_stats_ms_min] => 0.431 0.431 0.431
[update_stats_ms_max] => 0.530 0.530 0.530
[update_stats_ms_pct95] => 0.530 0.530 0.530
[update_stats_ms_pct99] => 0.530 0.530 0.530
){u'columns': [{u'Key': {u'type': u'string'}},
{u'Value': {u'type': u'string'}}],
u'data': [
{u'Key': u'table_type', u'Value': u'rt'}
{u'Key': u'indexed_documents', u'Value': u'3'}
{u'Key': u'indexed_bytes', u'Value': u'0'}
{u'Key': u'ram_bytes', u'Value': u'6678'}
{u'Key': u'disk_bytes', u'Value': u'611'}
{u'Key': u'ram_chunk', u'Value': u'990'}
{u'Key': u'ram_chunk_segments_count', u'Value': u'2'}
{u'Key': u'mem_limit', u'Value': u'134217728'}
{u'Key': u'ram_bytes_retired', u'Value': u'0'}
{u'Key': u'optimizing', u'Value': u'0'}
{u'Key': u'locked', u'Value': u'0'}
{u'Key': u'tid', u'Value': u'15'}
{u'Key': u'query_time_1min', u'Value': u'{"queries":1, "avg_sec":0.001, "min_sec":0.001, "max_sec":0.001, "pct95_sec":0.001, "pct99_sec":0.001}'}
{u'Key': u'query_time_5min', u'Value': u'{"queries":1, "avg_sec":0.001, "min_sec":0.001, "max_sec":0.001, "pct95_sec":0.001, "pct99_sec":0.001}'}
{u'Key': u'query_time_15min', u'Value': u'{"queries":1, "avg_sec":0.001, "min_sec":0.001, "max_sec":0.001, "pct95_sec":0.001, "pct99_sec":0.001}'}
{u'Key': u'query_time_total', u'Value': u'{"queries":1, "avg_sec":0.001, "min_sec":0.001, "max_sec":0.001, "pct95_sec":0.001, "pct99_sec":0.001}'}
{u'Key': u'found_rows_1min', u'Value': u'{"queries":1, "avg":3, "min":3, "max":3, "pct95":3, "pct99":3}'}
{u'Key': u'found_rows_5min', u'Value': u'{"queries":1, "avg":3, "min":3, "max":3, "pct95":3, "pct99":3}'}
{u'Key': u'found_rows_15min', u'Value': u'{"queries":1, "avg":3, "min":3, "max":3, "pct95":3, "pct99":3}'}
{u'Key': u'found_rows_total', u'Value': u'{"queries":1, "avg":3, "min":3, "max":3, "pct95":3, "pct99":3}'}
{u'Key': u'command_search', u'Value': u'2'}
{u'Key': u'command_excerpt', u'Value': u'0'}
{u'Key': u'command_update', u'Value': u'3'}
{u'Key': u'command_keywords', u'Value': u'0'}
{u'Key': u'command_status', u'Value': u'2'}
{u'Key': u'command_delete', u'Value': u'0'}
{u'Key': u'command_insert', u'Value': u'1'}
{u'Key': u'command_replace', u'Value': u'0'}
{u'Key': u'command_commit', u'Value': u'0'}
{u'Key': u'command_suggest', u'Value': u'0'}
{u'Key': u'command_callpq', u'Value': u'0'}
{u'Key': u'command_getfield', u'Value': u'0'}
{u'Key': u'insert_replace_stats_ms_avg', u'Value': u'0.284 0.284 0.284'}
{u'Key': u'insert_replace_stats_ms_min', u'Value': u'0.284 0.284 0.284'}
{u'Key': u'insert_replace_stats_ms_max', u'Value': u'0.284 0.284 0.284'}
{u'Key': u'insert_replace_stats_ms_pct95', u'Value': u'0.284 0.284 0.284'}
{u'Key': u'insert_replace_stats_ms_pct99', u'Value': u'0.284 0.284 0.284'}
{u'Key': u'search_stats_ms_avg', u'Value': u'0.000 0.000 0.000'}
{u'Key': u'search_stats_ms_min', u'Value': u'0.000 0.000 0.000'}
{u'Key': u'search_stats_ms_max', u'Value': u'0.000 0.000 0.000'}
{u'Key': u'search_stats_ms_pct95', u'Value': u'0.000 0.000 0.000'}
{u'Key': u'search_stats_ms_pct99', u'Value': u'0.000 0.000 0.000'}
{u'Key': u'update_stats_ms_avg', u'Value': u'0.479 0.479 0.479'}
{u'Key': u'update_stats_ms_min', u'Value': u'0.431 0.431 0.431'}
{u'Key': u'update_stats_ms_max', u'Value': u'0.530 0.530 0.530'}
{u'Key': u'update_stats_ms_pct95', u'Value': u'0.530 0.530 0.530'}
{u'Key': u'update_stats_ms_pct99', u'Value': u'0.530 0.530 0.530'}],
u'error': u'',
u'total': 0,
u'warning': u''}{u'columns': [{u'Key': {u'type': u'string'}},
{u'Value': {u'type': u'string'}}],
u'data': [
{u'Key': u'table_type', u'Value': u'rt'}
{u'Key': u'indexed_documents', u'Value': u'3'}
{u'Key': u'indexed_bytes', u'Value': u'0'}
{u'Key': u'ram_bytes', u'Value': u'6678'}
{u'Key': u'disk_bytes', u'Value': u'611'}
{u'Key': u'ram_chunk', u'Value': u'990'}
{u'Key': u'ram_chunk_segments_count', u'Value': u'2'}
{u'Key': u'mem_limit', u'Value': u'134217728'}
{u'Key': u'ram_bytes_retired', u'Value': u'0'}
{u'Key': u'optimizing', u'Value': u'0'}
{u'Key': u'locked', u'Value': u'0'}
{u'Key': u'tid', u'Value': u'15'}
{u'Key': u'query_time_1min', u'Value': u'{"queries":1, "avg_sec":0.001, "min_sec":0.001, "max_sec":0.001, "pct95_sec":0.001, "pct99_sec":0.001}'}
{u'Key': u'query_time_5min', u'Value': u'{"queries":1, "avg_sec":0.001, "min_sec":0.001, "max_sec":0.001, "pct95_sec":0.001, "pct99_sec":0.001}'}
{u'Key': u'query_time_15min', u'Value': u'{"queries":1, "avg_sec":0.001, "min_sec":0.001, "max_sec":0.001, "pct95_sec":0.001, "pct99_sec":0.001}'}
{u'Key': u'query_time_total', u'Value': u'{"queries":1, "avg_sec":0.001, "min_sec":0.001, "max_sec":0.001, "pct95_sec":0.001, "pct99_sec":0.001}'}
{u'Key': u'found_rows_1min', u'Value': u'{"queries":1, "avg":3, "min":3, "max":3, "pct95":3, "pct99":3}'}
{u'Key': u'found_rows_5min', u'Value': u'{"queries":1, "avg":3, "min":3, "max":3, "pct95":3, "pct99":3}'}
{u'Key': u'found_rows_15min', u'Value': u'{"queries":1, "avg":3, "min":3, "max":3, "pct95":3, "pct99":3}'}
{u'Key': u'found_rows_total', u'Value': u'{"queries":1, "avg":3, "min":3, "max":3, "pct95":3, "pct99":3}'}
{u'Key': u'command_search', u'Value': u'2'}
{u'Key': u'command_excerpt', u'Value': u'0'}
{u'Key': u'command_update', u'Value': u'3'}
{u'Key': u'command_keywords', u'Value': u'0'}
{u'Key': u'command_status', u'Value': u'2'}
{u'Key': u'command_delete', u'Value': u'0'}
{u'Key': u'command_insert', u'Value': u'1'}
{u'Key': u'command_replace', u'Value': u'0'}
{u'Key': u'command_commit', u'Value': u'0'}
{u'Key': u'command_suggest', u'Value': u'0'}
{u'Key': u'command_callpq', u'Value': u'0'}
{u'Key': u'command_getfield', u'Value': u'0'}
{u'Key': u'insert_replace_stats_ms_avg', u'Value': u'0.284 0.284 0.284'}
{u'Key': u'insert_replace_stats_ms_min', u'Value': u'0.284 0.284 0.284'}
{u'Key': u'insert_replace_stats_ms_max', u'Value': u'0.284 0.284 0.284'}
{u'Key': u'insert_replace_stats_ms_pct95', u'Value': u'0.284 0.284 0.284'}
{u'Key': u'insert_replace_stats_ms_pct99', u'Value': u'0.284 0.284 0.284'}
{u'Key': u'search_stats_ms_avg', u'Value': u'0.000 0.000 0.000'}
{u'Key': u'search_stats_ms_min', u'Value': u'0.000 0.000 0.000'}
{u'Key': u'search_stats_ms_max', u'Value': u'0.000 0.000 0.000'}
{u'Key': u'search_stats_ms_pct95', u'Value': u'0.000 0.000 0.000'}
{u'Key': u'search_stats_ms_pct99', u'Value': u'0.000 0.000 0.000'}
{u'Key': u'update_stats_ms_avg', u'Value': u'0.479 0.479 0.479'}
{u'Key': u'update_stats_ms_min', u'Value': u'0.431 0.431 0.431'}
{u'Key': u'update_stats_ms_max', u'Value': u'0.530 0.530 0.530'}
{u'Key': u'update_stats_ms_pct95', u'Value': u'0.530 0.530 0.530'}
{u'Key': u'update_stats_ms_pct99', u'Value': u'0.530 0.530 0.530'}],
u'error': u'',
u'total': 0,
u'warning': u''}{"columns": [{"Key": {"type": "string"}},
{"Value": {"type": "string"}}],
"data": [
{"Key": "table_type", "Value": "rt"}
{"Key": "indexed_documents", "Value": "3"}
{"Key": "indexed_bytes", "Value": "0"}
{"Key": "ram_bytes", "Value": "6678"}
{"Key": "disk_bytes", "Value": "611"}
{"Key": "ram_chunk", "Value": "990"}
{"Key": "ram_chunk_segments_count", "Value": "2"}
{"Key": "mem_limit", "Value": "134217728"}
{"Key": "ram_bytes_retired", "Value": "0"}
{"Key": "optimizing", "Value": "0"}
{"Key": "locked", "Value": "0"}
{"Key": "tid", "Value": "15"}
{"Key": "query_time_1min", "Value": "{"queries":1, "avg_sec":0.001, "min_sec":0.001, "max_sec":0.001, "pct95_sec":0.001, "pct99_sec":0.001}"}
{"Key": "query_time_5min", "Value": "{"queries":1, "avg_sec":0.001, "min_sec":0.001, "max_sec":0.001, "pct95_sec":0.001, "pct99_sec":0.001}"}
{"Key": "query_time_15min", "Value": "{"queries":1, "avg_sec":0.001, "min_sec":0.001, "max_sec":0.001, "pct95_sec":0.001, "pct99_sec":0.001}"}
{"Key": "query_time_total", "Value": "{"queries":1, "avg_sec":0.001, "min_sec":0.001, "max_sec":0.001, "pct95_sec":0.001, "pct99_sec":0.001}"}
{"Key": "found_rows_1min", "Value": "{"queries":1, "avg":3, "min":3, "max":3, "pct95":3, "pct99":3}"}
{"Key": "found_rows_5min", "Value": "{"queries":1, "avg":3, "min":3, "max":3, "pct95":3, "pct99":3}"}
{"Key": "found_rows_15min", "Value": "{"queries":1, "avg":3, "min":3, "max":3, "pct95":3, "pct99":3}"}
{"Key": "found_rows_total", "Value": "{"queries":1, "avg":3, "min":3, "max":3, "pct95":3, "pct99":3}"}
{"Key": "command_search", "Value": "2"}
{"Key": "command_excerpt", "Value": "0"}
{"Key": "command_update", "Value": "3"}
{"Key": "command_keywords", "Value": "0"}
{"Key": "command_status", "Value": "2"}
{"Key": "command_delete", "Value": "0"}
{"Key": "command_insert", "Value": "1"}
{"Key": "command_replace", "Value": "0"}
{"Key": "command_commit", "Value": "0"}
{"Key": "command_suggest", "Value": "0"}
{"Key": "command_callpq", "Value": "0"}
{"Key": "command_getfield", "Value": "0"}
{"Key": "insert_replace_stats_ms_avg", "Value": "0.284 0.284 0.284"}
{"Key": "insert_replace_stats_ms_min", "Value": "0.284 0.284 0.284"}
{"Key": "insert_replace_stats_ms_max", "Value": "0.284 0.284 0.284"}
{"Key": "insert_replace_stats_ms_pct95", "Value": "0.284 0.284 0.284"}
{"Key": "insert_replace_stats_ms_pct99", "Value": "0.284 0.284 0.284"}
{"Key": "search_stats_ms_avg", "Value": "0.000 0.000 0.000"}
{"Key": "search_stats_ms_min", "Value": "0.000 0.000 0.000"}
{"Key": "search_stats_ms_max", "Value": "0.000 0.000 0.000"}
{"Key": "search_stats_ms_pct95", "Value": "0.000 0.000 0.000"}
{"Key": "search_stats_ms_pct99", "Value": "0.000 0.000 0.000"}
{"Key": "update_stats_ms_avg", "Value": "0.479 0.479 0.479"}
{"Key": "update_stats_ms_min", "Value": "0.431 0.431 0.431"}
{"Key": "update_stats_ms_max", "Value": "0.530 0.530 0.530"}
{"Key": "update_stats_ms_pct95", "Value": "0.530 0.530 0.530"}
{"Key": "update_stats_ms_pct99", "Value": "0.530 0.530 0.530"}
],
"error": "",
"total": 0,
"warning": ""}{columns=[{ Key : { type=string }},
{ Value : { type=string }}],
data : [
{ Key=index_type, Value=rt}
{ Key=indexed_documents, Value=3}
{ Key=indexed_bytes, Value=0}
{ Key=ram_bytes, Value=6678}
{ Key=disk_bytes, Value=611}
{ Key=ram_chunk, Value=990}
{ Key=ram_chunk_segments_count, Value=2}
{ Key=mem_limit, Value=134217728}
{ Key=ram_bytes_retired, Value=0}
{ Key=optimizing, Value=0}
{ Key=locked, Value=0}
{ Key=tid, Value=15}
{ Key=query_time_1min, Value={queries:1, avg_sec:0.001, min_sec:0.001, max_sec:0.001, pct95_sec:0.001, pct99_sec:0.001}}
{ Key=query_time_5min, Value={queries:1, avg_sec:0.001, min_sec:0.001, max_sec:0.001, pct95_sec:0.001, pct99_sec:0.001}}
{ Key=query_time_15min, Value={queries:1, avg_sec:0.001, min_sec:0.001, max_sec:0.001, pct95_sec:0.001, pct99_sec:0.001}}
{ Key=query_time_total, Value={queries:1, avg_sec:0.001, min_sec:0.001, max_sec:0.001, pct95_sec:0.001, pct99_sec:0.001}}
{ Key=found_rows_1min, Value={queries:1, avg:3, min:3, max:3, pct95:3, pct99:3}}
{ Key=found_rows_5min, Value={queries:1, avg:3, min:3, max:3, pct95:3, pct99:3}}
{ Key=found_rows_15min, Value={queries:1, avg:3, min:3, max:3, pct95:3, pct99:3}}
{ Key=found_rows_total, Value={queries:1, avg:3, min:3, max:3, pct95:3, pct99:3}}
{ Key=command_search, Value=2}
{ Key=command_excerpt, Value=0}
{ Key=command_update, Value=3}
{ Key=command_keywords, Value=0}
{ Key=command_status, Value=2}
{ Key=command_delete, Value=0}
{ Key=command_insert, Value=1}
{ Key=command_replace, Value=0}
{ Key=command_commit, Value=0}
{ Key=command_suggest, Value=0}
{ Key=command_callpq, Value=0}
{ Key=command_getfield, Value=0}
{ Key=insert_replace_stats_ms_avg, Value=0.284 0.284 0.284}
{ Key=insert_replace_stats_ms_min, Value=0.284 0.284 0.284}
{ Key=insert_replace_stats_ms_max, Value=0.284 0.284 0.284}
{ Key=insert_replace_stats_ms_pct95, Value=0.284 0.284 0.284}
{ Key=insert_replace_stats_ms_pct99, Value=0.284 0.284 0.284}
{ Key=search_stats_ms_avg, Value=0.000 0.000 0.000}
{ Key=search_stats_ms_min, Value=0.000 0.000 0.000}
{ Key=search_stats_ms_max, Value=0.000 0.000 0.000}
{ Key=search_stats_ms_pct95, Value=0.000 0.000 0.000}
{ Key=search_stats_ms_pct99, Value=0.000 0.000 0.000}
{ Key=update_stats_ms_avg, Value=0.479 0.479 0.479}
{ Key=update_stats_ms_min, Value=0.431 0.431 0.431}
{ Key=update_stats_ms_max, Value=0.530 0.530 0.530}
{ Key=update_stats_ms_pct95, Value=0.530 0.530 0.530}
{ Key=update_stats_ms_pct99, Value=0.530 0.530 0.530}
],
error= ,
total=0,
warning= }{columns=[{ Key : { type=string }},
{ Value : { type=string }}],
data : [
{ Key=index_type, Value=rt}
{ Key=indexed_documents, Value=3}
{ Key=indexed_bytes, Value=0}
{ Key=ram_bytes, Value=6678}
{ Key=disk_bytes, Value=611}
{ Key=ram_chunk, Value=990}
{ Key=ram_chunk_segments_count, Value=2}
{ Key=mem_limit, Value=134217728}
{ Key=ram_bytes_retired, Value=0}
{ Key=optimizing, Value=0}
{ Key=locked, Value=0}
{ Key=tid, Value=15}
{ Key=query_time_1min, Value={queries:1, avg_sec:0.001, min_sec:0.001, max_sec:0.001, pct95_sec:0.001, pct99_sec:0.001}}
{ Key=query_time_5min, Value={queries:1, avg_sec:0.001, min_sec:0.001, max_sec:0.001, pct95_sec:0.001, pct99_sec:0.001}}
{ Key=query_time_15min, Value={queries:1, avg_sec:0.001, min_sec:0.001, max_sec:0.001, pct95_sec:0.001, pct99_sec:0.001}}
{ Key=query_time_total, Value={queries:1, avg_sec:0.001, min_sec:0.001, max_sec:0.001, pct95_sec:0.001, pct99_sec:0.001}}
{ Key=found_rows_1min, Value={queries:1, avg:3, min:3, max:3, pct95:3, pct99:3}}
{ Key=found_rows_5min, Value={queries:1, avg:3, min:3, max:3, pct95:3, pct99:3}}
{ Key=found_rows_15min, Value={queries:1, avg:3, min:3, max:3, pct95:3, pct99:3}}
{ Key=found_rows_total, Value={queries:1, avg:3, min:3, max:3, pct95:3, pct99:3}}
{ Key=command_search, Value=2}
{ Key=command_excerpt, Value=0}
{ Key=command_update, Value=3}
{ Key=command_keywords, Value=0}
{ Key=command_status, Value=2}
{ Key=command_delete, Value=0}
{ Key=command_insert, Value=1}
{ Key=command_replace, Value=0}
{ Key=command_commit, Value=0}
{ Key=command_suggest, Value=0}
{ Key=command_callpq, Value=0}
{ Key=command_getfield, Value=0}
{ Key=insert_replace_stats_ms_avg, Value=0.284 0.284 0.284}
{ Key=insert_replace_stats_ms_min, Value=0.284 0.284 0.284}
{ Key=insert_replace_stats_ms_max, Value=0.284 0.284 0.284}
{ Key=insert_replace_stats_ms_pct95, Value=0.284 0.284 0.284}
{ Key=insert_replace_stats_ms_pct99, Value=0.284 0.284 0.284}
{ Key=search_stats_ms_avg, Value=0.000 0.000 0.000}
{ Key=search_stats_ms_min, Value=0.000 0.000 0.000}
{ Key=search_stats_ms_max, Value=0.000 0.000 0.000}
{ Key=search_stats_ms_pct95, Value=0.000 0.000 0.000}
{ Key=search_stats_ms_pct99, Value=0.000 0.000 0.000}
{ Key=update_stats_ms_avg, Value=0.479 0.479 0.479}
{ Key=update_stats_ms_min, Value=0.431 0.431 0.431}
{ Key=update_stats_ms_max, Value=0.530 0.530 0.530}
{ Key=update_stats_ms_pct95, Value=0.530 0.530 0.530}
{ Key=update_stats_ms_pct99, Value=0.530 0.530 0.530}
],
error="" ,
total=0,
warning="" }{columns=[{ Key : { type=string }},
{ Value : { type=string }}],
data : [
{ Key=index_type, Value=rt}
{ Key=indexed_documents, Value=3}
{ Key=indexed_bytes, Value=0}
{ Key=ram_bytes, Value=6678}
{ Key=disk_bytes, Value=611}
{ Key=ram_chunk, Value=990}
{ Key=ram_chunk_segments_count, Value=2}
{ Key=mem_limit, Value=134217728}
{ Key=ram_bytes_retired, Value=0}
{ Key=optimizing, Value=0}
{ Key=locked, Value=0}
{ Key=tid, Value=15}
{ Key=query_time_1min, Value={queries:1, avg_sec:0.001, min_sec:0.001, max_sec:0.001, pct95_sec:0.001, pct99_sec:0.001}}
{ Key=query_time_5min, Value={queries:1, avg_sec:0.001, min_sec:0.001, max_sec:0.001, pct95_sec:0.001, pct99_sec:0.001}}
{ Key=query_time_15min, Value={queries:1, avg_sec:0.001, min_sec:0.001, max_sec:0.001, pct95_sec:0.001, pct99_sec:0.001}}
{ Key=query_time_total, Value={queries:1, avg_sec:0.001, min_sec:0.001, max_sec:0.001, pct95_sec:0.001, pct99_sec:0.001}}
{ Key=found_rows_1min, Value={queries:1, avg:3, min:3, max:3, pct95:3, pct99:3}}
{ Key=found_rows_5min, Value={queries:1, avg:3, min:3, max:3, pct95:3, pct99:3}}
{ Key=found_rows_15min, Value={queries:1, avg:3, min:3, max:3, pct95:3, pct99:3}}
{ Key=found_rows_total, Value={queries:1, avg:3, min:3, max:3, pct95:3, pct99:3}}
{ Key=command_search, Value=2}
{ Key=command_excerpt, Value=0}
{ Key=command_update, Value=3}
{ Key=command_keywords, Value=0}
{ Key=command_status, Value=2}
{ Key=command_delete, Value=0}
{ Key=command_insert, Value=1}
{ Key=command_replace, Value=0}
{ Key=command_commit, Value=0}
{ Key=command_suggest, Value=0}
{ Key=command_callpq, Value=0}
{ Key=command_getfield, Value=0}
{ Key=insert_replace_stats_ms_avg, Value=0.284 0.284 0.284}
{ Key=insert_replace_stats_ms_min, Value=0.284 0.284 0.284}
{ Key=insert_replace_stats_ms_max, Value=0.284 0.284 0.284}
{ Key=insert_replace_stats_ms_pct95, Value=0.284 0.284 0.284}
{ Key=insert_replace_stats_ms_pct99, Value=0.284 0.284 0.284}
{ Key=search_stats_ms_avg, Value=0.000 0.000 0.000}
{ Key=search_stats_ms_min, Value=0.000 0.000 0.000}
{ Key=search_stats_ms_max, Value=0.000 0.000 0.000}
{ Key=search_stats_ms_pct95, Value=0.000 0.000 0.000}
{ Key=search_stats_ms_pct99, Value=0.000 0.000 0.000}
{ Key=update_stats_ms_avg, Value=0.479 0.479 0.479}
{ Key=update_stats_ms_min, Value=0.431 0.431 0.431}
{ Key=update_stats_ms_max, Value=0.530 0.530 0.530}
{ Key=update_stats_ms_pct95, Value=0.530 0.530 0.530}
{ Key=update_stats_ms_pct99, Value=0.530 0.530 0.530}
],
error="" ,
total=0,
warning="" }{
"columns":
[{
"Key": {"type": "string"}
},
{
"Value": {"type": "string"}
}],
"data":
[
{"Key": "table_type", "Value": "rt"}
{"Key": "indexed_documents", "Value": "3"}
{"Key": "indexed_bytes", "Value": "0"}
{"Key": "ram_bytes", "Value": "6678"}
{"Key": "disk_bytes", "Value": "611"}
{"Key": "ram_chunk", "Value": "990"}
{"Key": "ram_chunk_segments_count", "Value": "2"}
{"Key": "mem_limit", "Value": "134217728"}
{"Key": "ram_bytes_retired", "Value": "0"}
{"Key": "optimizing", "Value": "0"}
{"Key": "locked", "Value": "0"}
{"Key": "tid", "Value": "15"}
{"Key": "query_time_1min", "Value": "{"queries":1, "avg_sec":0.001, "min_sec":0.001, "max_sec":0.001, "pct95_sec":0.001, "pct99_sec":0.001}"}
{"Key": "query_time_5min", "Value": "{"queries":1, "avg_sec":0.001, "min_sec":0.001, "max_sec":0.001, "pct95_sec":0.001, "pct99_sec":0.001}"}
{"Key": "query_time_15min", "Value": "{"queries":1, "avg_sec":0.001, "min_sec":0.001, "max_sec":0.001, "pct95_sec":0.001, "pct99_sec":0.001}"}
{"Key": "query_time_total", "Value": "{"queries":1, "avg_sec":0.001, "min_sec":0.001, "max_sec":0.001, "pct95_sec":0.001, "pct99_sec":0.001}"}
{"Key": "found_rows_1min", "Value": "{"queries":1, "avg":3, "min":3, "max":3, "pct95":3, "pct99":3}"}
{"Key": "found_rows_5min", "Value": "{"queries":1, "avg":3, "min":3, "max":3, "pct95":3, "pct99":3}"}
{"Key": "found_rows_15min", "Value": "{"queries":1, "avg":3, "min":3, "max":3, "pct95":3, "pct99":3}"}
{"Key": "found_rows_total", "Value": "{"queries":1, "avg":3, "min":3, "max":3, "pct95":3, "pct99":3}"}
{"Key": "command_search", "Value": "2"}
{"Key": "command_excerpt", "Value": "0"}
{"Key": "command_update", "Value": "3"}
{"Key": "command_keywords", "Value": "0"}
{"Key": "command_status", "Value": "2"}
{"Key": "command_delete", "Value": "0"}
{"Key": "command_insert", "Value": "1"}
{"Key": "command_replace", "Value": "0"}
{"Key": "command_commit", "Value": "0"}
{"Key": "command_suggest", "Value": "0"}
{"Key": "command_callpq", "Value": "0"}
{"Key": "command_getfield", "Value": "0"}
{"Key": "insert_replace_stats_ms_avg", "Value": "0.284 0.284 0.284"}
{"Key": "insert_replace_stats_ms_min", "Value": "0.284 0.284 0.284"}
{"Key": "insert_replace_stats_ms_max", "Value": "0.284 0.284 0.284"}
{"Key": "insert_replace_stats_ms_pct95", "Value": "0.284 0.284 0.284"}
{"Key": "insert_replace_stats_ms_pct99", "Value": "0.284 0.284 0.284"}
{"Key": "search_stats_ms_avg", "Value": "0.000 0.000 0.000"}
{"Key": "search_stats_ms_min", "Value": "0.000 0.000 0.000"}
{"Key": "search_stats_ms_max", "Value": "0.000 0.000 0.000"}
{"Key": "search_stats_ms_pct95", "Value": "0.000 0.000 0.000"}
{"Key": "search_stats_ms_pct99", "Value": "0.000 0.000 0.000"}
{"Key": "update_stats_ms_avg", "Value": "0.479 0.479 0.479"}
{"Key": "update_stats_ms_min", "Value": "0.431 0.431 0.431"}
{"Key": "update_stats_ms_max", "Value": "0.530 0.530 0.530"}
{"Key": "update_stats_ms_pct95", "Value": "0.530 0.530 0.530"}
{"Key": "update_stats_ms_pct99", "Value": "0.530 0.530 0.530"}
],
"error": "",
"total": 0,
"warning": ""
}{
"columns":
[{
"Key": {"type": "string"}
},
{
"Value": {"type": "string"}
}],
"data":
[
{"Key": "table_type", "Value": "rt"}
{"Key": "indexed_documents", "Value": "3"}
{"Key": "indexed_bytes", "Value": "0"}
{"Key": "ram_bytes", "Value": "6678"}
{"Key": "disk_bytes", "Value": "611"}
{"Key": "ram_chunk", "Value": "990"}
{"Key": "ram_chunk_segments_count", "Value": "2"}
{"Key": "mem_limit", "Value": "134217728"}
{"Key": "ram_bytes_retired", "Value": "0"}
{"Key": "optimizing", "Value": "0"}
{"Key": "locked", "Value": "0"}
{"Key": "tid", "Value": "15"}
{"Key": "query_time_1min", "Value": "{"queries":1, "avg_sec":0.001, "min_sec":0.001, "max_sec":0.001, "pct95_sec":0.001, "pct99_sec":0.001}"}
{"Key": "query_time_5min", "Value": "{"queries":1, "avg_sec":0.001, "min_sec":0.001, "max_sec":0.001, "pct95_sec":0.001, "pct99_sec":0.001}"}
{"Key": "query_time_15min", "Value": "{"queries":1, "avg_sec":0.001, "min_sec":0.001, "max_sec":0.001, "pct95_sec":0.001, "pct99_sec":0.001}"}
{"Key": "query_time_total", "Value": "{"queries":1, "avg_sec":0.001, "min_sec":0.001, "max_sec":0.001, "pct95_sec":0.001, "pct99_sec":0.001}"}
{"Key": "found_rows_1min", "Value": "{"queries":1, "avg":3, "min":3, "max":3, "pct95":3, "pct99":3}"}
{"Key": "found_rows_5min", "Value": "{"queries":1, "avg":3, "min":3, "max":3, "pct95":3, "pct99":3}"}
{"Key": "found_rows_15min", "Value": "{"queries":1, "avg":3, "min":3, "max":3, "pct95":3, "pct99":3}"}
{"Key": "found_rows_total", "Value": "{"queries":1, "avg":3, "min":3, "max":3, "pct95":3, "pct99":3}"}
{"Key": "command_search", "Value": "2"}
{"Key": "command_excerpt", "Value": "0"}
{"Key": "command_update", "Value": "3"}
{"Key": "command_keywords", "Value": "0"}
{"Key": "command_status", "Value": "2"}
{"Key": "command_delete", "Value": "0"}
{"Key": "command_insert", "Value": "1"}
{"Key": "command_replace", "Value": "0"}
{"Key": "command_commit", "Value": "0"}
{"Key": "command_suggest", "Value": "0"}
{"Key": "command_callpq", "Value": "0"}
{"Key": "command_getfield", "Value": "0"}
{"Key": "insert_replace_stats_ms_avg", "Value": "0.284 0.284 0.284"}
{"Key": "insert_replace_stats_ms_min", "Value": "0.284 0.284 0.284"}
{"Key": "insert_replace_stats_ms_max", "Value": "0.284 0.284 0.284"}
{"Key": "insert_replace_stats_ms_pct95", "Value": "0.284 0.284 0.284"}
{"Key": "insert_replace_stats_ms_pct99", "Value": "0.284 0.284 0.284"}
{"Key": "search_stats_ms_avg", "Value": "0.000 0.000 0.000"}
{"Key": "search_stats_ms_min", "Value": "0.000 0.000 0.000"}
{"Key": "search_stats_ms_max", "Value": "0.000 0.000 0.000"}
{"Key": "search_stats_ms_pct95", "Value": "0.000 0.000 0.000"}
{"Key": "search_stats_ms_pct99", "Value": "0.000 0.000 0.000"}
{"Key": "update_stats_ms_avg", "Value": "0.479 0.479 0.479"}
{"Key": "update_stats_ms_min", "Value": "0.431 0.431 0.431"}
{"Key": "update_stats_ms_max", "Value": "0.530 0.530 0.530"}
{"Key": "update_stats_ms_pct95", "Value": "0.530 0.530 0.530"}
{"Key": "update_stats_ms_pct99", "Value": "0.530 0.530 0.530"}
],
"error": "",
"total": 0,
"warning": ""
}